Foundations
What gold actually is — and why that matters
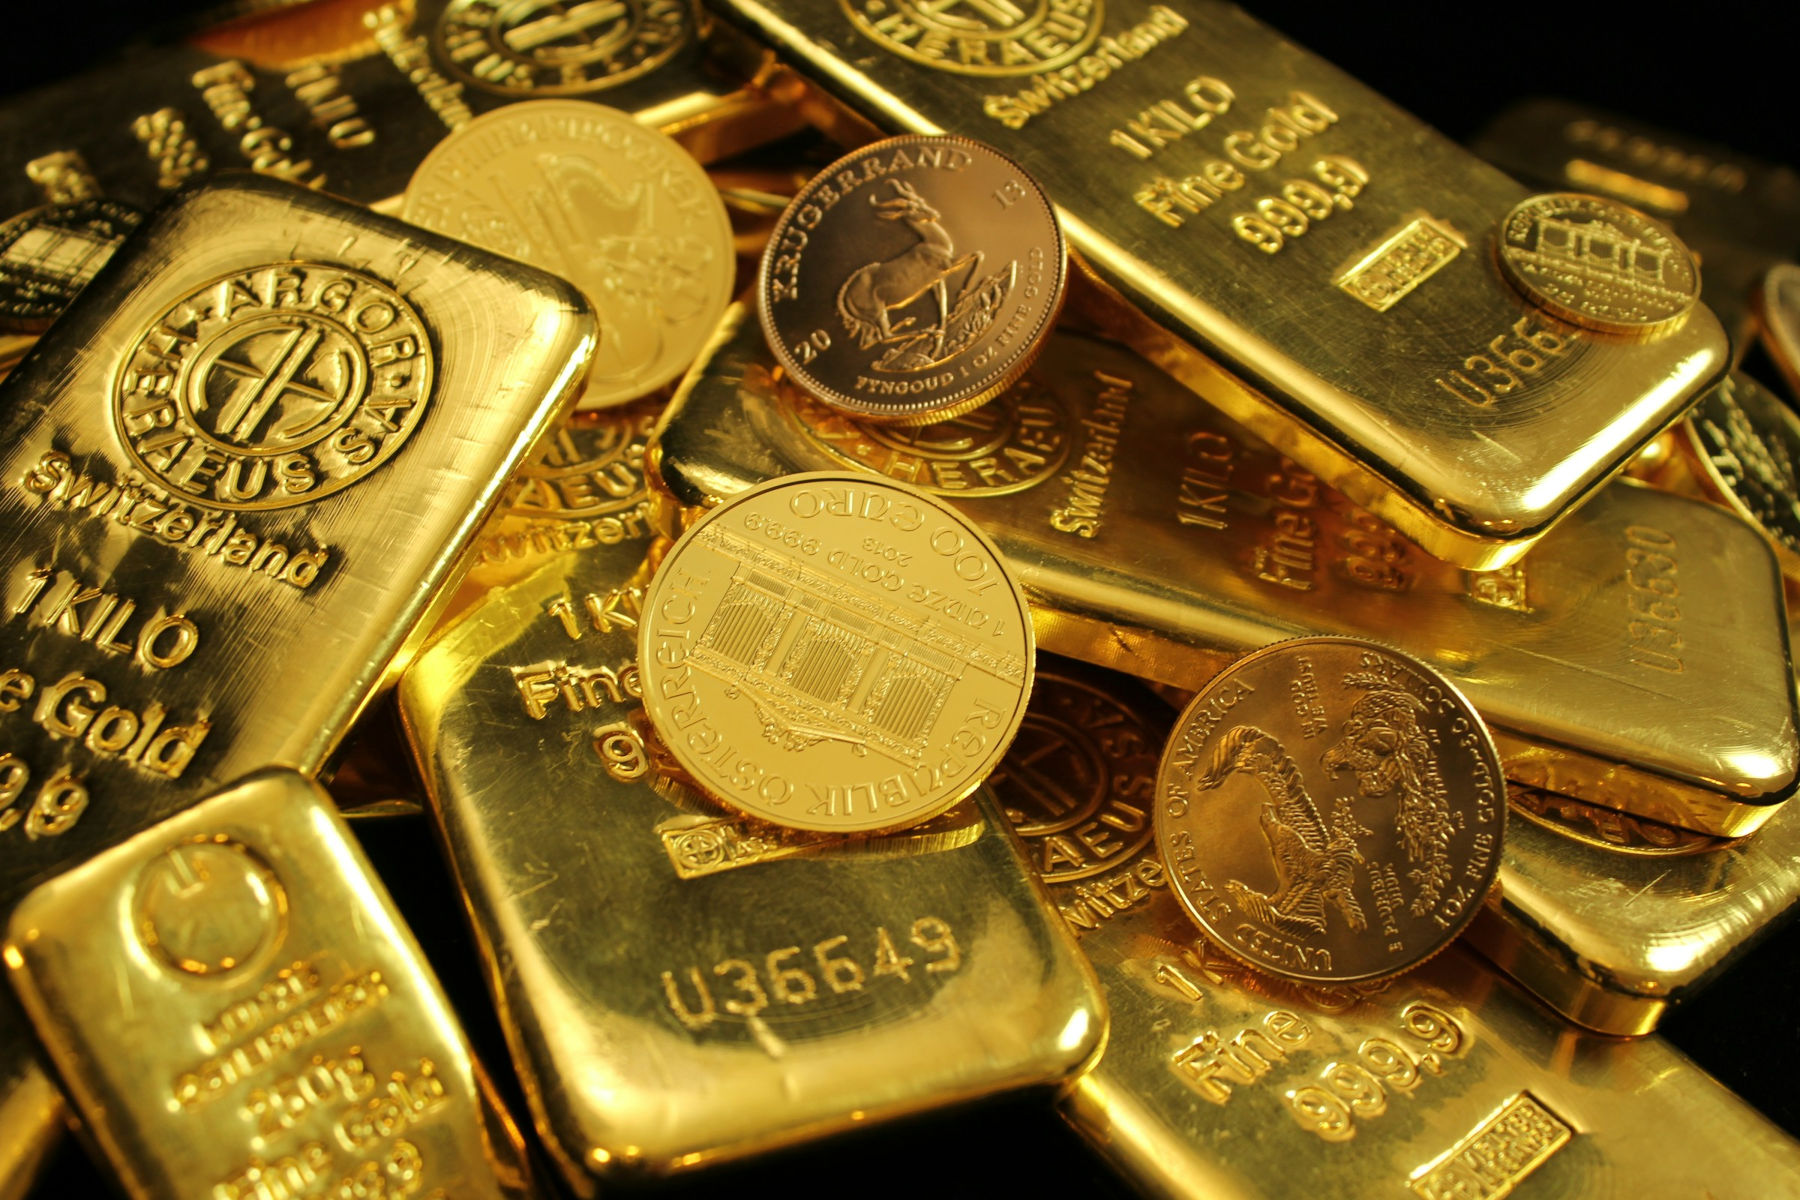
Gold is a chemical element: a dense, soft, yellow metal that has been prized by virtually every human civilisation for at least 5,000 years. Its value does not come from usefulness alone — most gold sits in vaults, not in circuit boards. Its value comes from scarcity, durability, and trust.
Unlike fiat currency, gold cannot be printed. The entire above-ground stock — roughly 212,000 tonnes, enough to fill three Olympic swimming pools — has accumulated over millennia. Annual mine production adds only about 1.5% to that stock each year. This predictable, slow-growing supply is the foundation of gold's role as a monetary anchor.
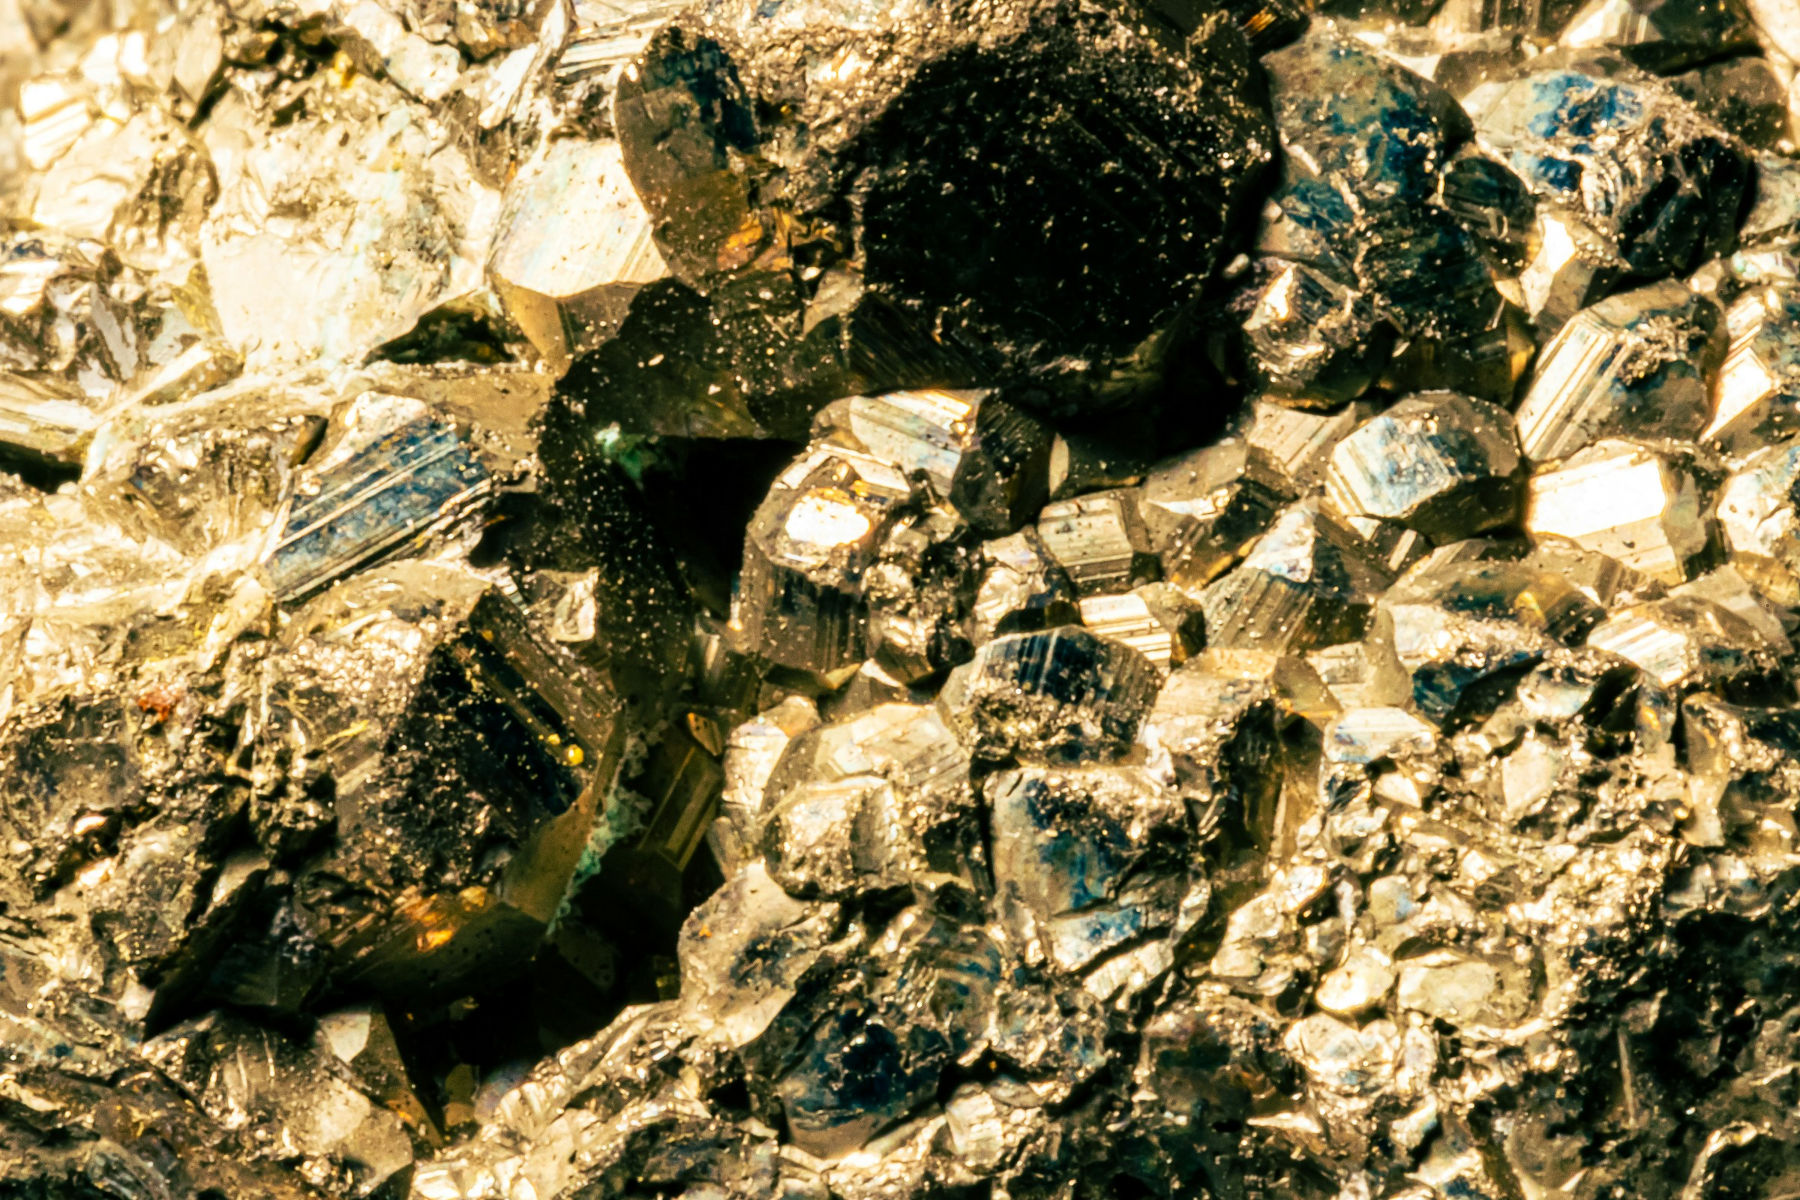
Scarcity
All the gold ever mined fits in a 22-metre cube. New supply grows only ~1.5% per year.
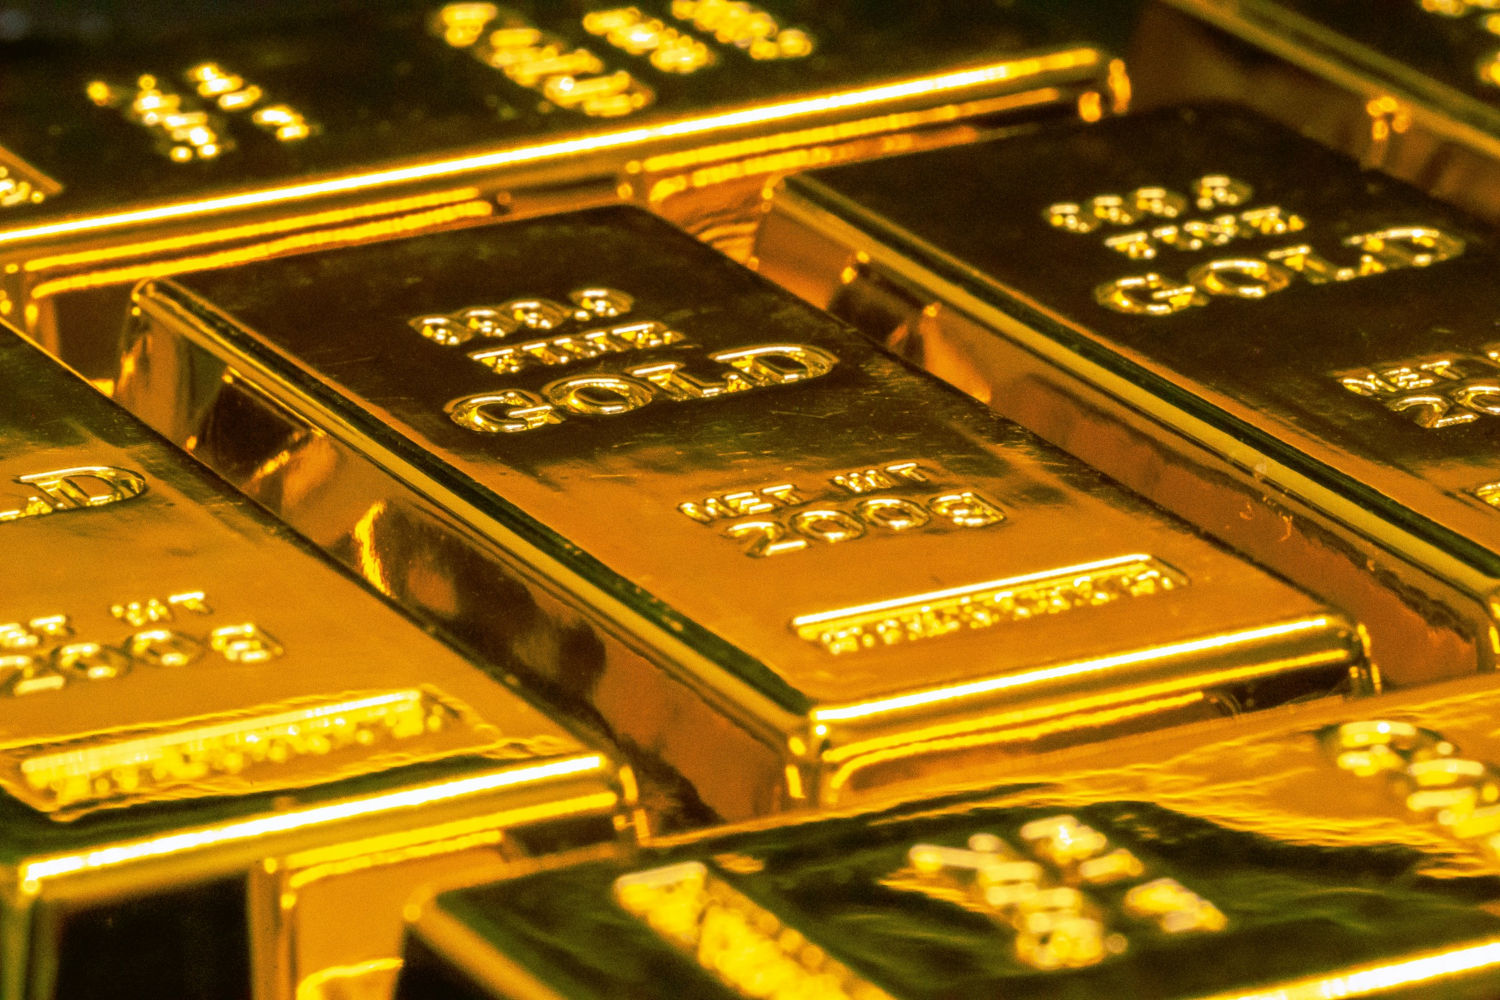
Durability
Gold does not corrode, tarnish, or decay. A coin struck in 500 BC is still recognisable today.
Liquidity
Gold trades 24 hours a day, five and a half days a week, in markets exceeding $200 billion daily turnover.
No counterparty
Unlike a bond or a bank deposit, gold is no one's liability. It cannot default.